

It requires a lot of effort to plan a marketing campaign, create a landing page for it & successfully execute it.
Imagine someone sees your campaign & visits your landing page without you noticing it.
All the hard work that you’ve put will go down the drain. Wouldn’t it?
So, to avoid that, you need to track & monitor the performance of your campaign and Analytics is the perfect tool for it.
Read on to learn & understand:
- The 8 Key Landing Page Metrics you should be Tracking
- How to Set-Up Goals in Google Analytics
- How to Track your Landing Page Analytics in Databox
The 8 Key Landing Page Metrics you should be Tracking
In order to know how successfully you’re marketing campaign is running, you need to track & monitor the 8 metrics that we are going to discuss.
1. Landing Page Views
To manage the performance of your campaign, it is very important to establish how many times has your landing page been viewed.
To do this:
Go to Google Analytics > Navigate to Behaviour > Site Content > All Pages.
In the All Pages view, find the URL for your landing page & click on it.
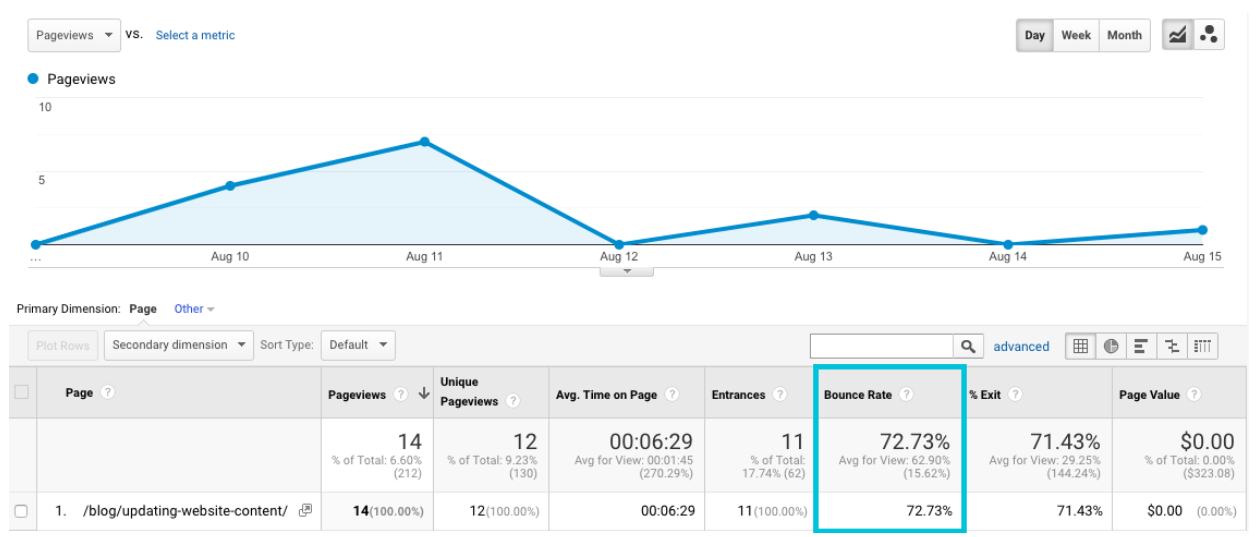
As soon as you click on it, you’ll see a report showing several key metrics for your landing page like:
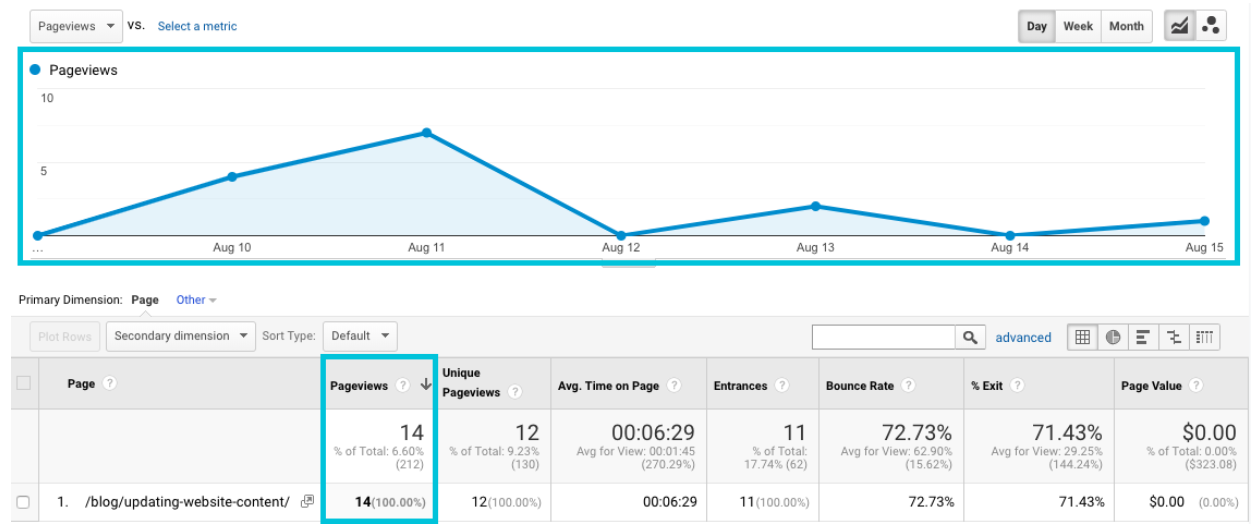
- Pageviews
- Unique Pageviews
- Average time on page
- Entrances
- Bounce Rate
- Percent exit
- Page value
Check pageviews metric to know exactly how many times has your page been viewed. For more information, you can have a look at chart that shows pageviews by day. By seeing these details, you’ll know whether people visit your site on the weekends more on weekdays. Also, which events or promotions have had the most views.
2. Sessions by Source
We all do promotions through different mediums & sources at the same time but to know where is the most traffic coming from is essential.
This helps you understand what works & what not.
If monitoring a pillar page is your goal, you’ll definitely want to know & identify if your organic & paid reach are helping to increase traffic & conversion rates.
Similarly, if monitoring a lead generation offer is your goal, analyzation of landing page sessions can help you understand which channels are working for you the most. Whether it is blogs, social or e-mail nurturing, take whatever works & amplify it to get the most out of your promotions.
To find out where the traffic to your landing page is coming from in Google Analytics,
Navigate to Behavior > Site Content > All Pages
In the All Pages view, find the URL for your landing page, and click on it. Then, add a secondary dimension for Source.
This will add another column to your report showing the source of your landing page visits, plus additional metrics like time on page and bounce rate for each source.

3. Goal Completions/Conversions
For this purpose, you’ll need to set-up goals in Google Analytics.
Read on to learn how to set-up goals & monitor exactly how many people visited your landing page & above all, took action. This action can be detected when a visitor completes a form, clicks a link or downloads an offer.
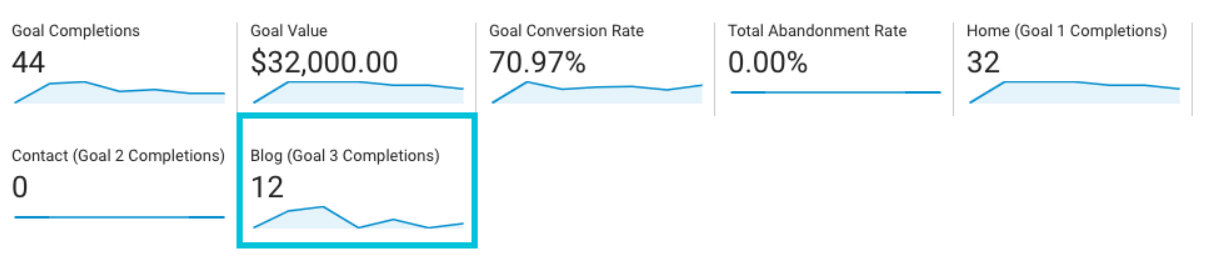
Once you’ve set-up goals, you’ll be able to track the number of conversion for your landing page & also the percentage of visitors who converted.
To find this information, Navigate to Conversions > Goals > Overview.
To see the total number of completions, look for the name of your goal:
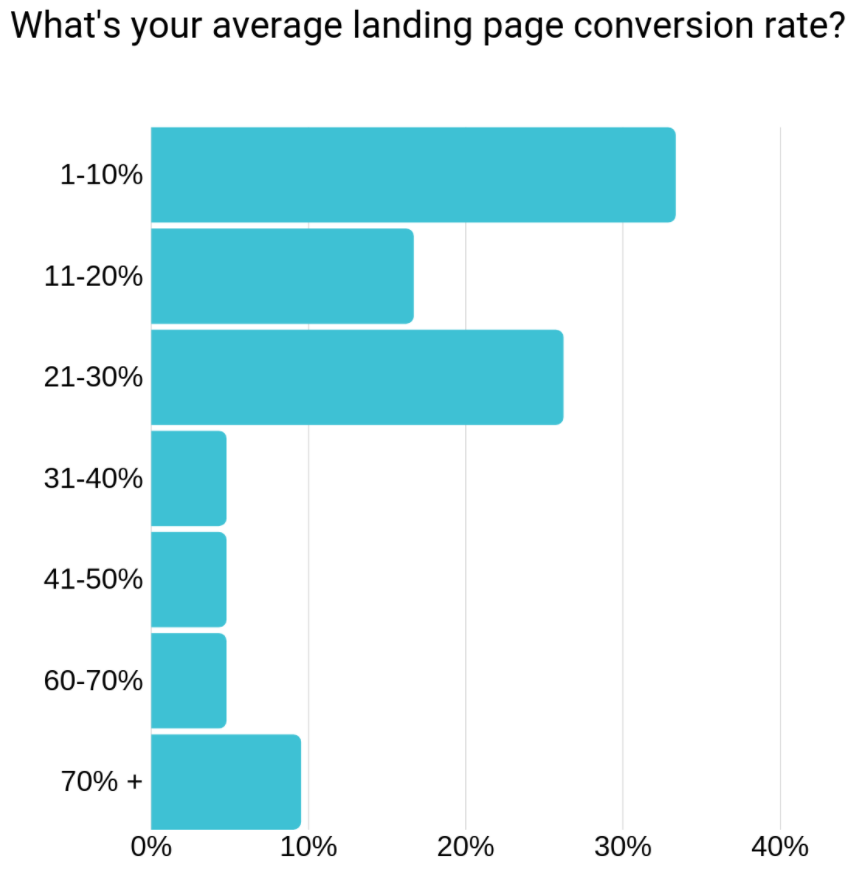
What Is a Good Conversion Rate for a Landing Page?
According to a survey conducted amongst marketers, the average conversion rate from their responses was 26%. Thus, anything above 26% shows that you have a good landing page.
4. Visitors-to-Contact Ratio
Naturally, you’d have a certain number of contacts that you need at the end of your campaign. So, it is very important to set your visitor-to-contact ratio.
This helps to measure the number of contacts you are converting & driving sufficient traffic to convert the desired number of prospects into leads.
5. Average Time on Page
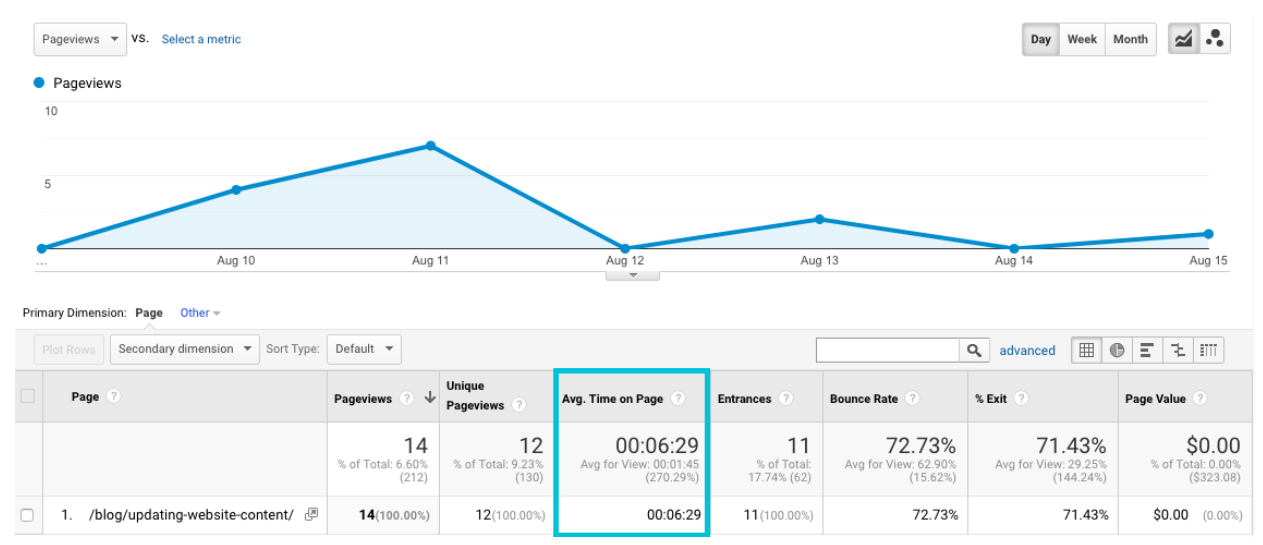
It is very interesting to know exactly how long have you been able to hold your visitors on the landing page. If your visitors are spending time on your page, it means that the information on your page is valuable.
On the other hand, if visitors are spending less time on your page, you might need to make a few changes to it. Thus, monitoring the average time on page is very important.
To find the average time on page for your landing page in Google Analytics,
Navigate to Behavior > Site Content > All Pages.
In the All Pages view, find the URL for your landing page & click on it. Your average time on page will be displayed in this report.
6. Bounce Rate
You need to monitor if the visitors are not bouncing off or leaving your site after visiting just one page. So, it is important to keep your bounce rate (shown in percentage) as low as possible.
If you have a high bounce rate, it means:
- Your offer was not clear & visitors were unsure of the action they should take.
- Your offer needs improvement.
- Your campaign promotion & messaging were unclear or misleading & visitors were disappointed once they hit the landing page.
To find the bounce rate for your landing page in Google Analytics,
Navigate to Behavior > Site Content > All Pages.
In the All Pages view, find the URL for your landing page, and click on it. Your landing page’s bounce rate will be displayed in this report.
7. Pages per Session
By tracking pages per session, you can easily evaluate if your visitors are getting enough information they need to make a decision. If your pages per session count is too high, it means that you’re landing page dies not have sufficient information.
To track pages per session for your landing page in Google Analytics,
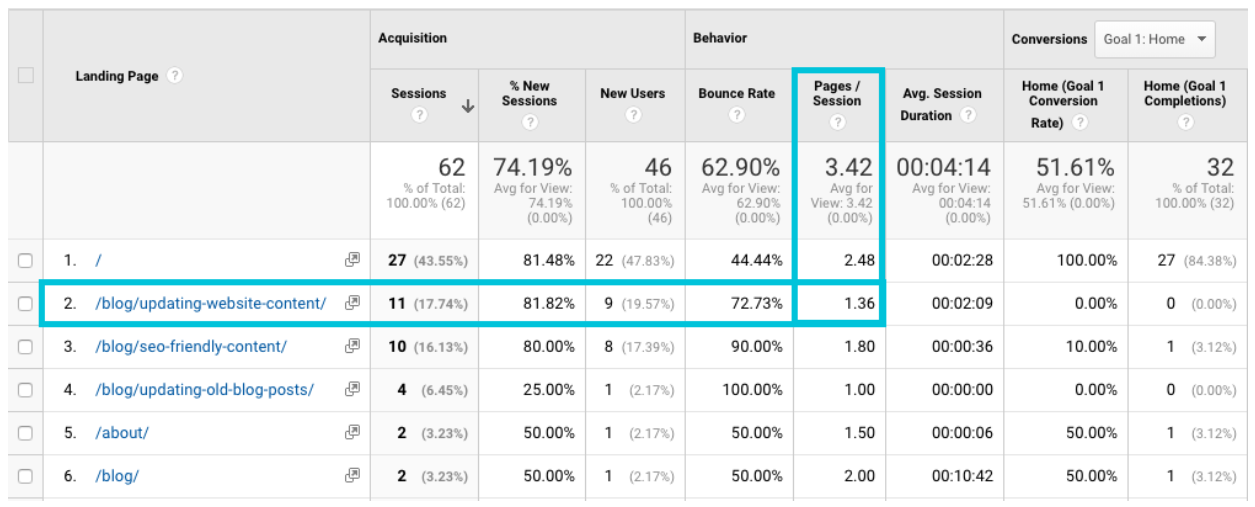
Navigate to Behavior > Site Content > Landing Pages.
In the Landing Pages view, find the URL for your landing page and look for the Pages/Session column to see the average number of pages visitors viewed when entering your site through your landing page.
We’ve been saying landing page over & over again in this blog but what exactly is a Landing Page in Google Analytics?
Well, that’s simple.
It is the first page users visited when they arrived on your site & so the landing page report is a list of all the pages that your visitors viewed first.
It is important to keep in mind that this Landing Page report will contain all marketing landing pages, blog posts, knowledge base entries & almost every other type of content your visitors first viewed.
So, not to get confused!
8. Top Pages by Pageviews
This information is critical to understand especially when you are running multiple campaigns & want to determine which of your campaign is lacking so you know exactly where to put some extra effort. This gives you an overall picture of how your landing page is performing in relation to all of your other content pages.
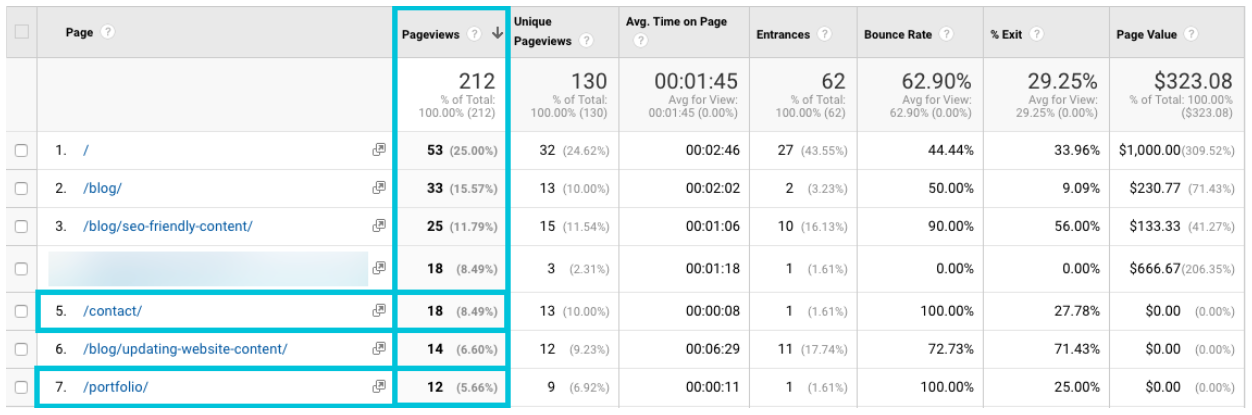
To find your top pages by pageviews in Google Analytics,
Navigate to Behavior > Site Content > All Pages.
By default, the report will list all of your site’s pages in order of most-to-least pageviews. Thus, it is easy to see how your different landing pages are performing against each other.
How to Set Up Goals in Google Analytics.
As discussed earlier in this blog, it is very important to set up goals in Google Analytics.
So, let’s ensure you have your goals set up first & then we’ll learn how to create a data dashboard to track your most important landing page metrics.
To create a goal for your landing page in Google Analytics:
1. Click the Admin tab in Google Analytics’ left navigation menu.
2. In the Admin menu, select Goals under the View cloumn.
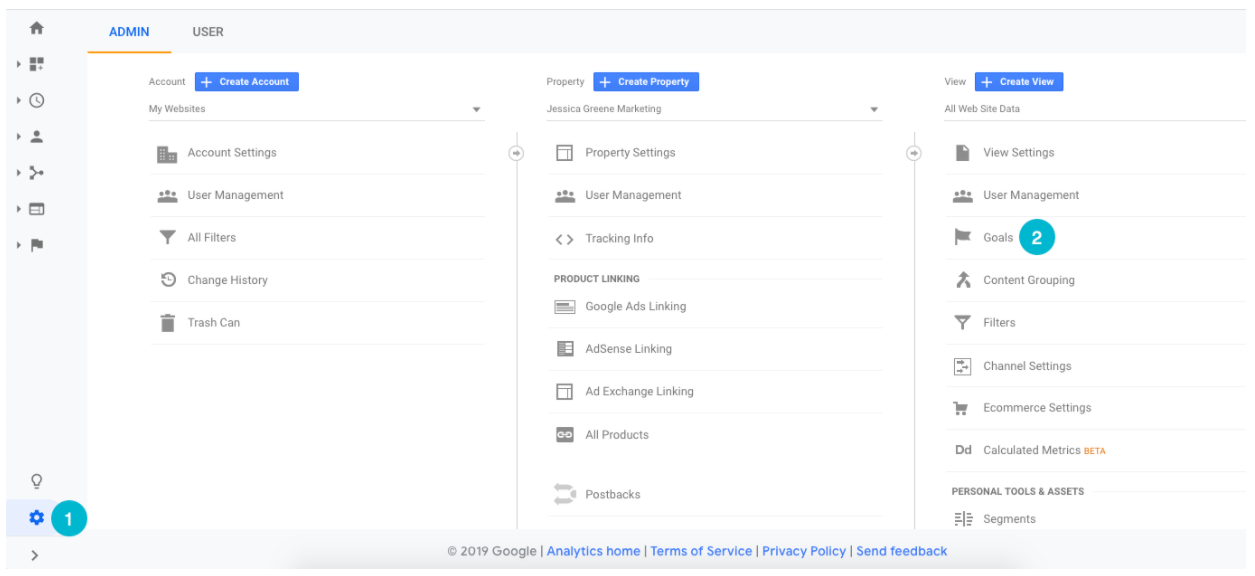
3. Click the + NEW GOAL button.
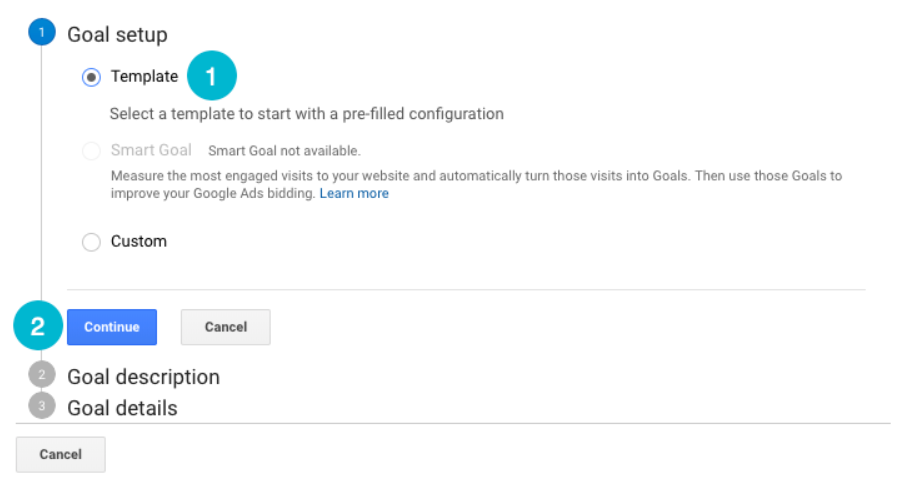
4. Select the Template radio button and click the Continue button.
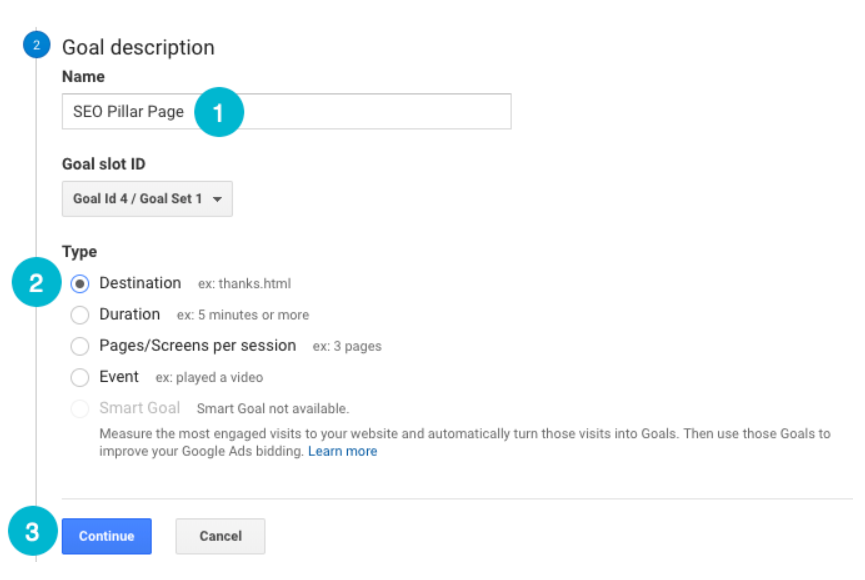
5. Give your new goal a name, select the Destination radio button and click Continue.
6. Next, add the URL of the destination that should be considered a goal completion. Most likely, this will be the URL of the Thank you page for your landing page.
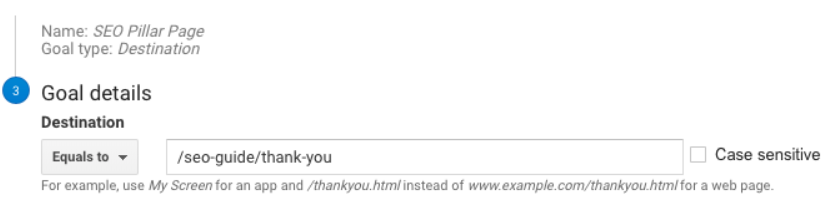
For a better understanding, let’s say you have a form on your landing page. If the user fills out your form, they’ll be redirected to a thank you page that will show their conversion.
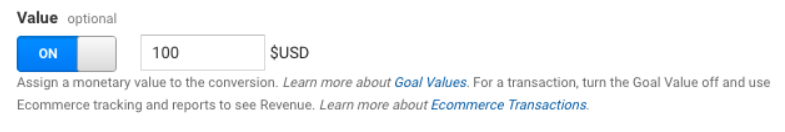
7. If you want to add a monetary value to each goal completion, toggle on the Value field and add a dollar amount (optional).
8. Last, click Save to save your goal and start tracking your landing page conversions.
Now, that you’ve completed all the initial steps required to set up your Google Analytics, let’s take a look at how you can build your own landing page dashboard in Databox.
How to Track Your Landing Page Analytics in Databox
Who doesn’t like to get all the information they need, at a glance?
Marketing dashboards make it easier to analyze the data for all your campaigns.
While Google Analytics has some good dashboard templates, it is still a lot easier to drag & drop the key metrics you need to monitor & tools like Databox, serve that purpose.
Below is an example of the Google Analytics Landing Page & Lead Tracking Dashboard, designed to track traffic & leads for a landing page.
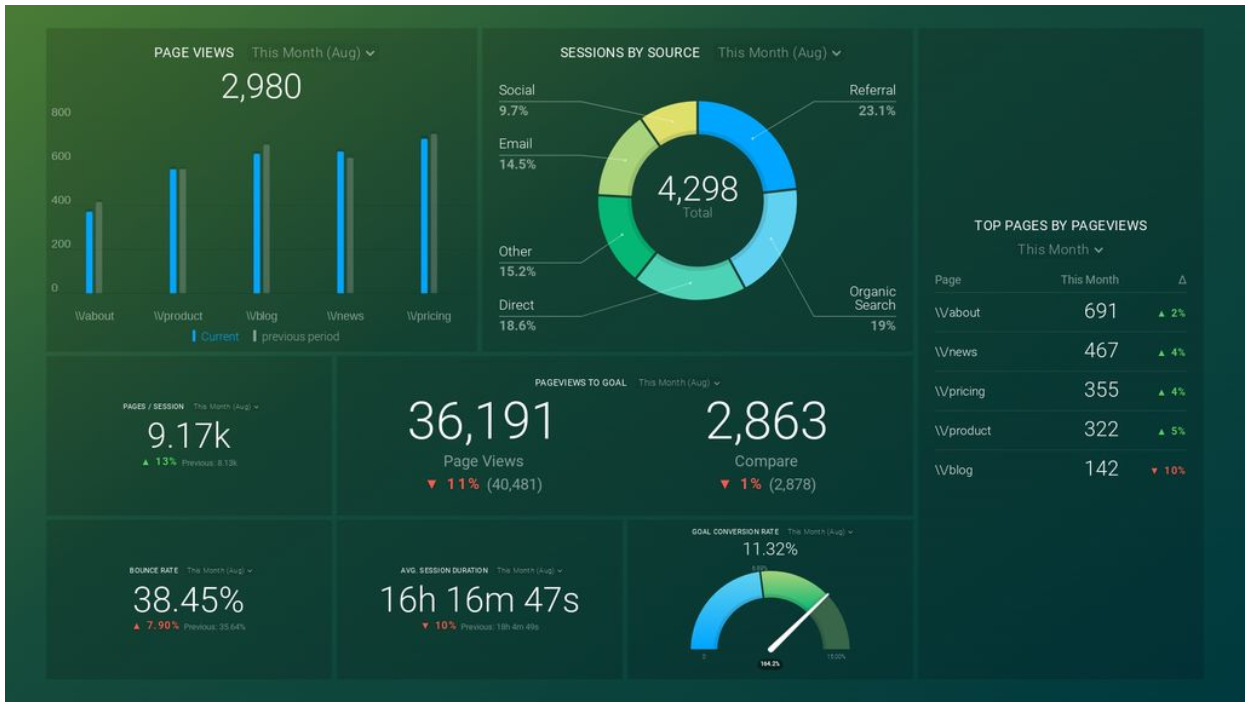
Using such dashboards make it a lot easier to get all information at one place so you don’t waste time in finding & clicking through different screens in Google Analytics.
So, you want to set up a dashboard like this in Databox as well?
Here’s how you can do that for your landing pages.
Step 1: Sign Up for a Free Databox Account
First, you need to sign up for a free Databox account to proceed.
If you already have an account on Databox, sign in & visit the landing page for the Google Analytics Landing Page & Lead Tracking dashboard template.
Then, click the Get Your Dashboard For Free button.
Step 2: Connect Databox to Google Analytics
Using Databox for the first time?
Start by connecting your Google Analytics account to Databox. You’ll be prompted to do so in order to pull data from Analytics.
If you already have Analytics connected to your existing account, just select the data source.

Step 3: Adjust the Pageviews Data block
Once your data has been imported into Databox, you’ll need to organize & make some adjustments to it.
You can start doing this with the pageviews Data block. Click the pageviews block to open the settings panel. Then, in the Dimensions dropdown, select your landing page.
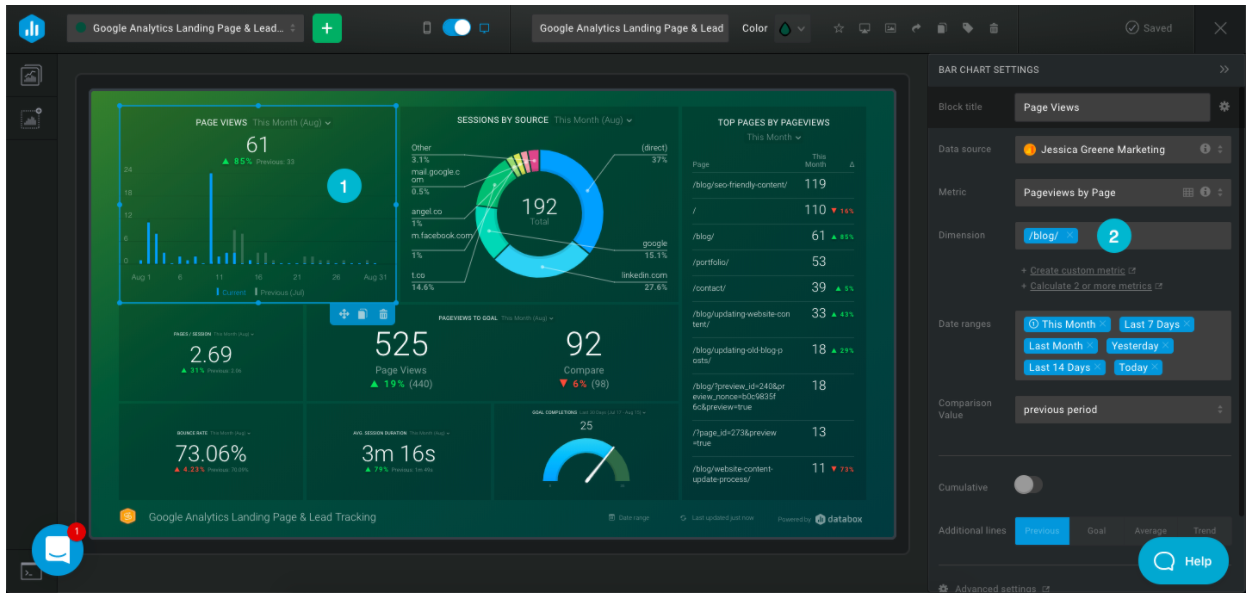
The pageview Data block will refresh & then only show the pageview data for your landing page.
Step 4: Adjust the Pages/Session Data block
Click on the Pages/Session Data block to open the settings panel.
Then, click the Metric dropdown, select Custom & click New Custom Metric.
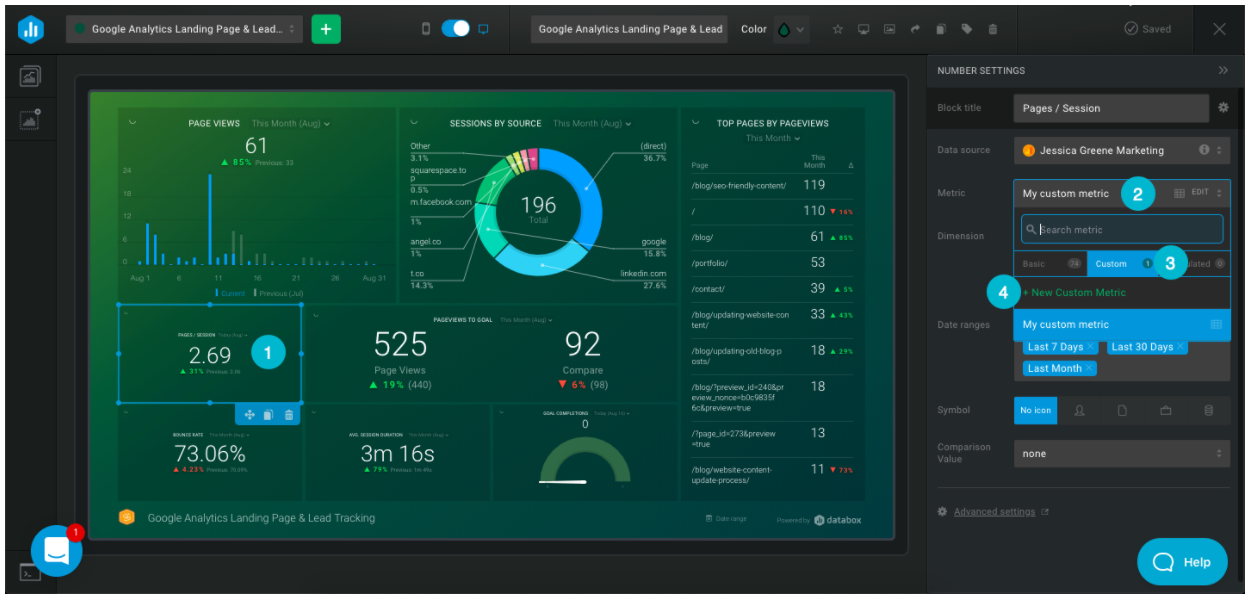
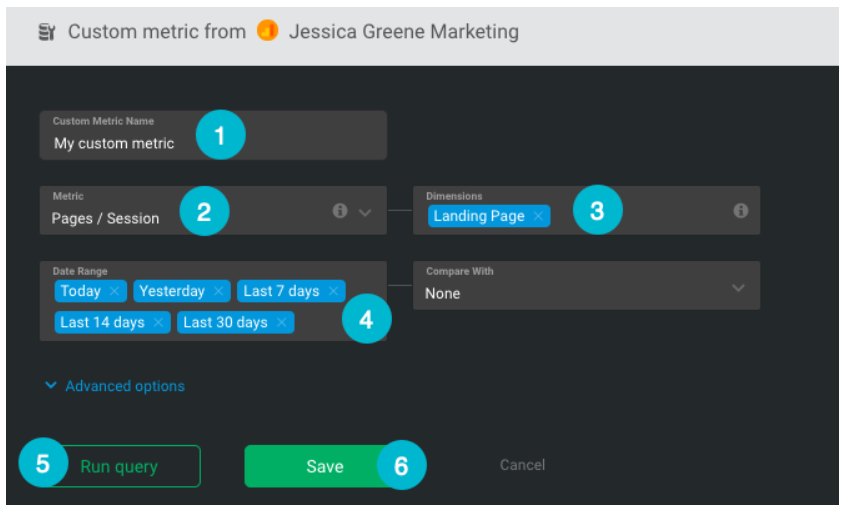
Give your metric a name, select Pages/Session in the Metric column & select Landing Page in the Dimensions column.
Next, add the date ranges you want to be able to look at in the Date range dropdown.
Finally, click the Run query button. If your query is successful, you’ll be able to save your metric.
Now, for this Data block to show only pages per session for your landing page, you can select your landing page in the Dimension dropdown.

Step 5: Adjust the Bounce Rate Data block
- To adjust the Bounce rate Data block, you need to:
- Click on the Bounce Rate Datablock to open the settings panel.
- Then, click the Metric dropdown, select Custom & click New Custom Metric.
- Give your metric a name, select Bounce Rate in the Metric column & select Landing Page in the Dimensions column.
- Next, add the date ranges you want to be able to look at in the Date range dropdown.
- Finally, click the Run query button. If your query is successful, you’ll be able to save your metric.
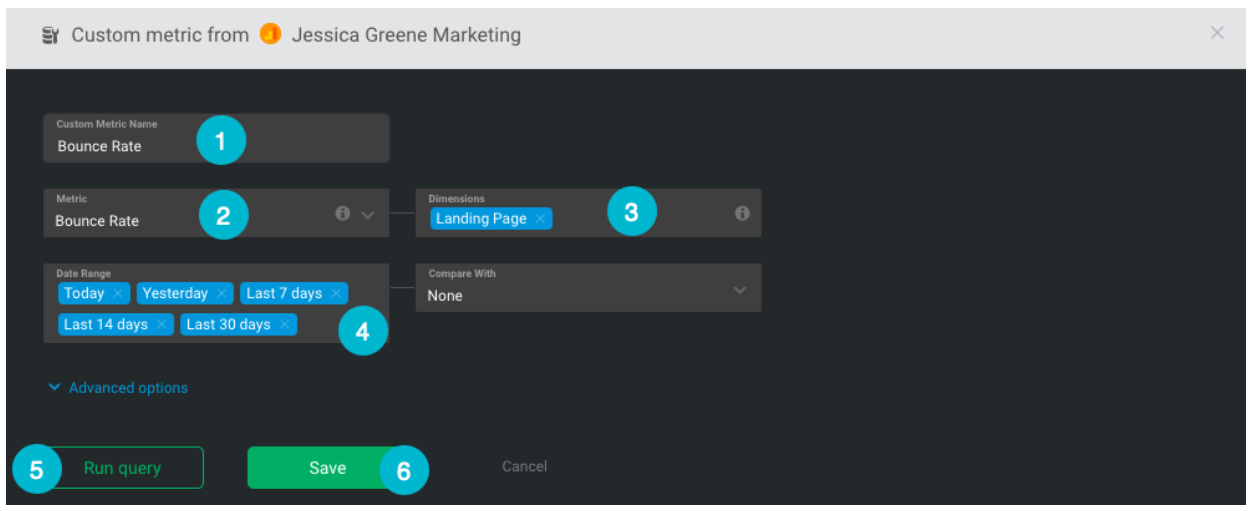
Now, select your landing page in the Dimension dropdown to have this Data Block to show only the bounce rate for your landing page.
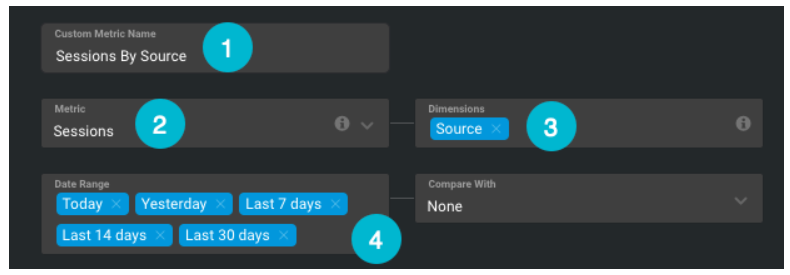
Step 6: Adjust the Sessions by Source Data block
- Click on Sessions By Source Data block to open the settings panel.
- Then, click the Metric dropdown, select Custom & click New Custom Metric.
- Give your metric a name, select Sessions in the Metric column & select Source in the Dimensions column.
- Next, add the date ranges you want to be able to look at in the Date range dropdown.
From here, click the Advanced options link to expand the advanced options section.
Under filters, select:
- by Dimension in the Filter dropdown
- Landing Page in the Dimension dropdown
- Exact match in the Operator dropdown.
- For Dimension enter the final portion of your landing page’s URL (i.e. /blog/ rather than https://databox.com/blog/).
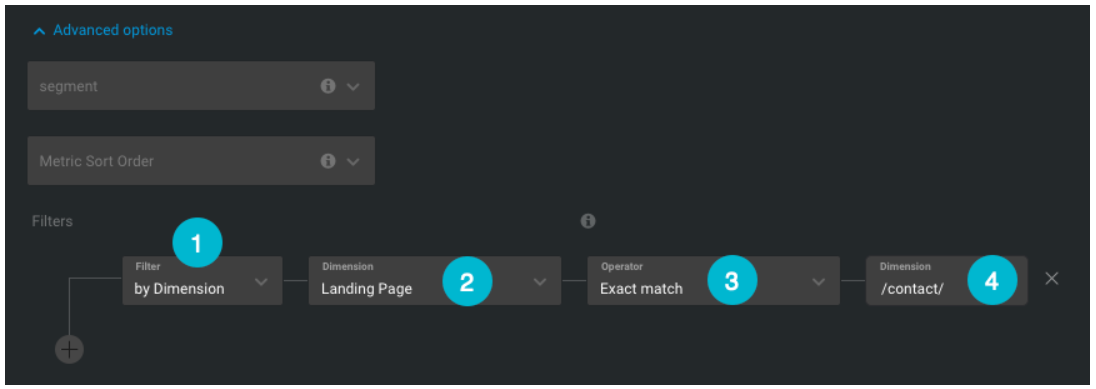
Finally, click the Run query button.
If your query is successful, you’ll be able to save your metric.
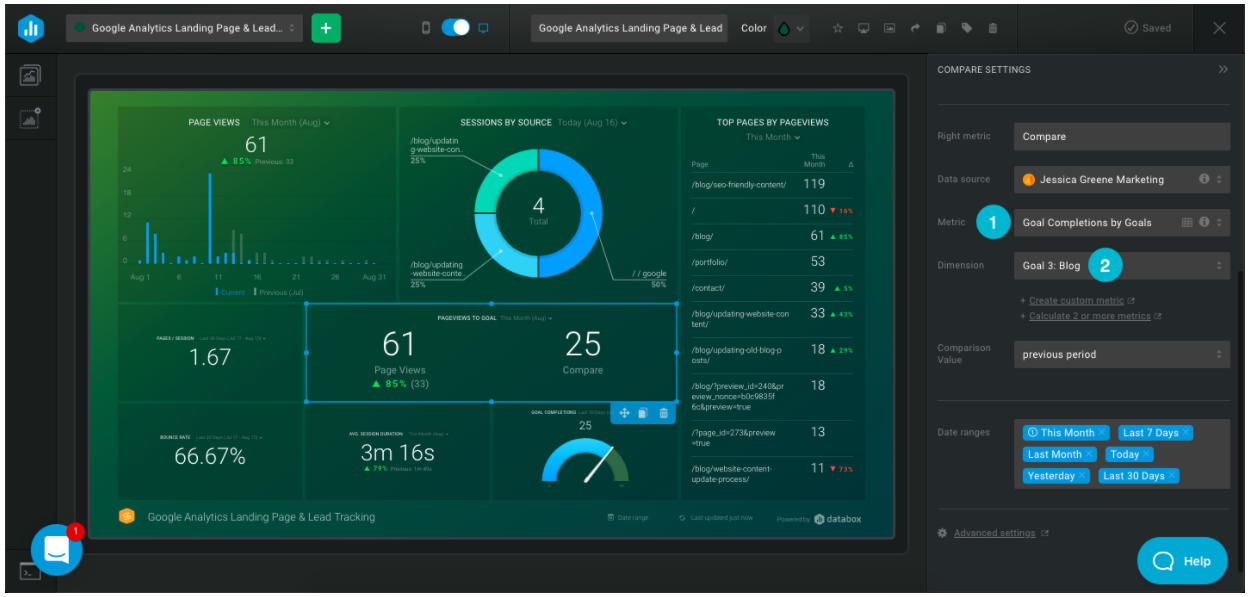
Step 7: Adjust the Pageviews to Goal Data block
Click on the Pageviews to Goal Data block to open the settings panel.
Then, for the Left metric, click the Metric dropdown & select Pageviews by Page.
In the Dimensions dropdown, select your landing page.
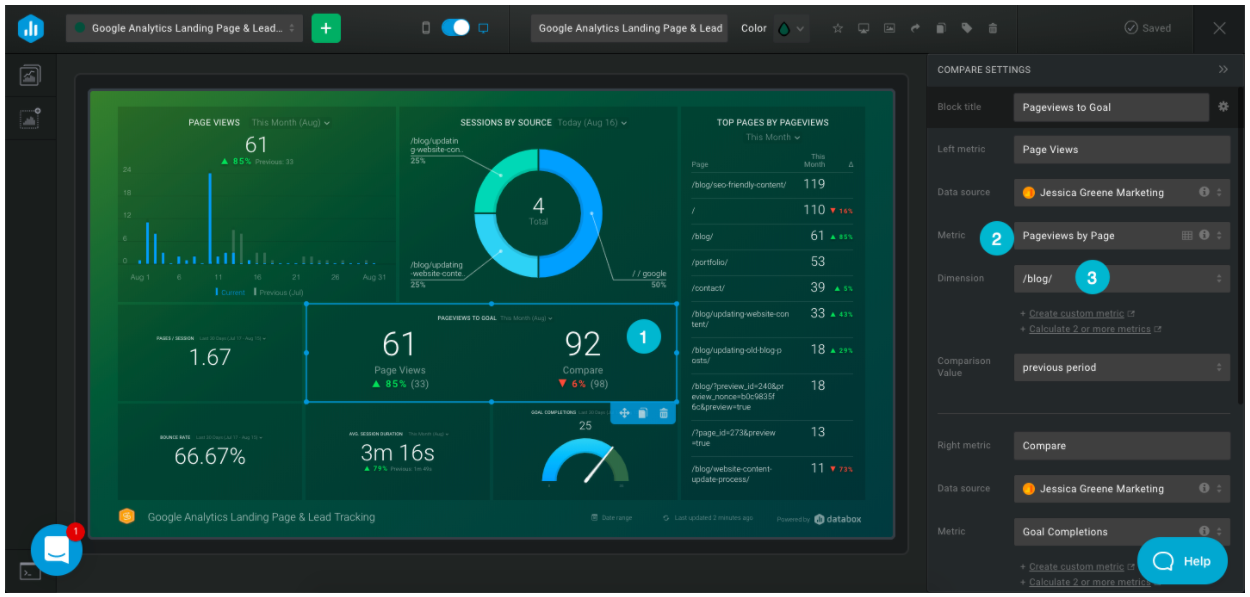
For the Right metric, change the Metric to Goal Completions by Goals & select the goal for your landing page.
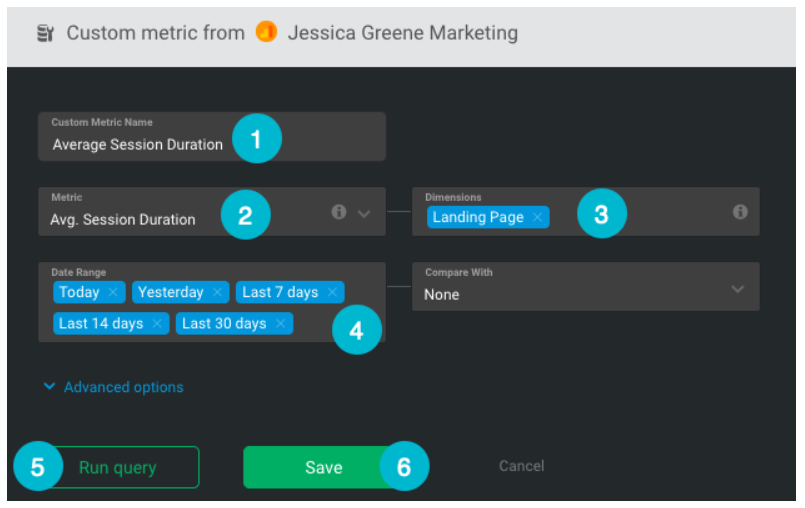
Step 8: Adjust the Average Session Duration Data block
- Click on the Avg. Session Duration Datablock to open the settings panel.
- Then, click the Metric dropdown, select Custom & click New Custom Metric.
- Give your metric a name, select Avg. Session Duration in the Metric column & select Landing Page in the Dimensions column.
- Next, add the date ranges you want to be able to look at in the Date range dropdown.
- Finally, click the Run query button.
If your query is successful, you’ll be able to save your metric.
Now, you can select your landing page in the Dimension dropdown to have this Data block to only show the bounce rate for your landing page.
Step 9: Set the Right Goal for your Goal Conversion Rate Data block
Click on the Goal Conversion Rate Data block to open the settings panel.
Then:
- Rename your goal to “Goal Completions.”
- Select the Goal Completions by Goal metric.
- Select the appropriate goal for your landing page
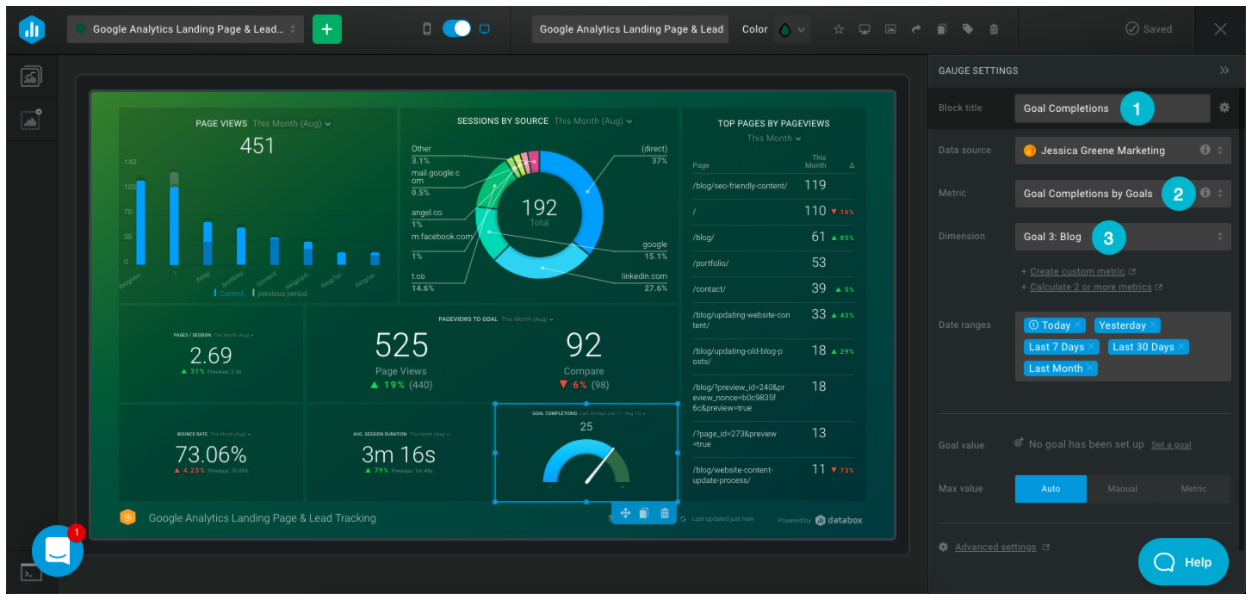
You’ll see that your dashboard now shows goal completions specifically for your landing page goal.
Step 10: Adjust Top Pages by Pageviews (Optional)
By default, the Top Pages by Pageviews Data block will show the number of pageviews each page of your site receives.
If your site has lots of pages, you may need to adjust the number of rows that display in this Data block to make sure you can see pageview data for all of the landing pages you want to compare.
To adjust the number of rows that display, click the Top Pages by Pageviews Datablock.
Then, scroll down in the settings panel until you see Limit rows. Adjust this number according to your need.
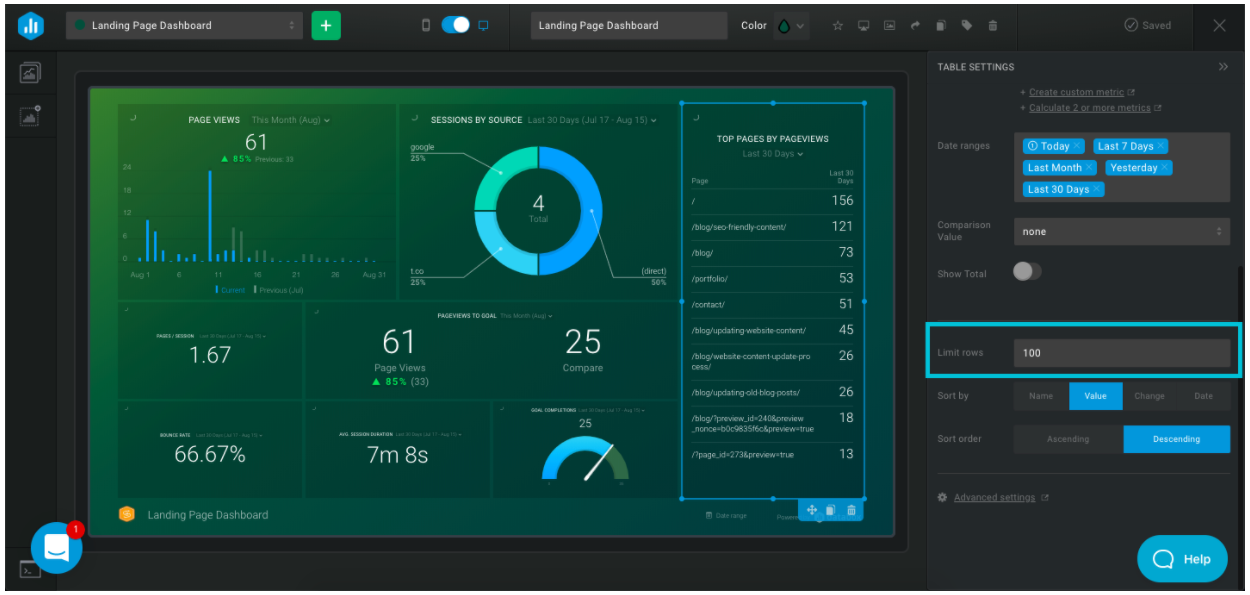
Then, you can scroll up and down over that Data block to view all of your pages sorted from most-to-least pageviews.
Through this guide, we are sure you’ve been able to create your first landing page dashboard to track the most important landing page metrics in Databox.
Follow these simple steps to create dashboards for all your landing pages. This will surely help you to understand & tailor your marketing campaigns to get the best results.