
Conversion rate optimisation (CRO) is about making sure your website gives users what they want. To do this, you need to know what they’re looking for. By keeping an eye on CRO metrics and key performance indicators (KPIs), you can see where users are finding what they need on your site—and where they’re not.
This helps you tweak your website’s design, messages, and marketing to guide users towards completing important actions. But you can’t track everything at once. So, which metrics and KPIs should you focus on?
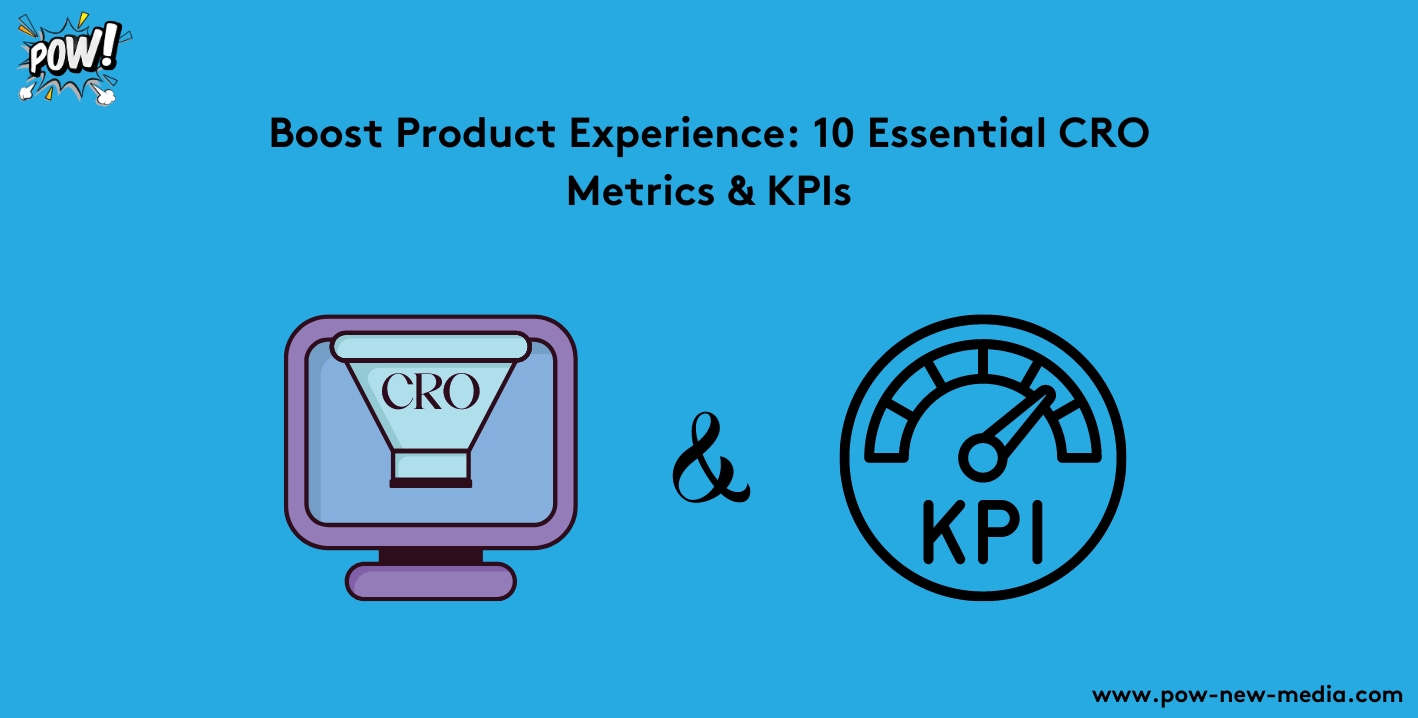
Our guide will show you the 10 most important ones. They’ll help you understand how customers use your website and make it easier for them to buy what they want.
10 Essential CRO Metrics for Boosting Website Conversions
Here are some important numbers to help you make more people buy things on your website. Remember, every website is different, so don’t worry too much about comparing your numbers to others’. Instead, focus on what’s best for your own goals.
We’ll start by looking at different types of numbers that can tell you how well your website is doing, then we’ll talk about other important numbers you should keep an eye on.
1. Macro-conversions
Your main conversion rate shows how successful your website is overall. It’s calculated by dividing the total number of times people do what you want (like buying something or signing up) by the total number of people who visit your site.
These important actions, called macro conversions, depend on what you’re aiming for in your industry—whether it’s making a sale, getting someone to try your product, or filling out a contact form.
2. Micro-conversions
Micro-conversions represent the smaller actions users take on your website, which lead them closer to bigger conversion goals. These actions can include browsing category or product pages, watching demo videos, or adding items to their cart or wishlist.
By tracking micro-conversions, teams can pinpoint weaknesses in their marketing or sales strategies, such as pages where users leave the site, revealing areas where engagement with website visitors is lacking. Combining conversion metrics with qualitative user feedback allows for a deeper understanding of user behavior.
Once you understand both macro and micro conversions, consider placing POW New Media’s Feedback widget or on-site surveys on crucial conversion pages (like checkout or signup pages). This allows users to share their experiences & reasons for converting or not.
Voice-of-the-customer (VoC) data highlights user obstacles and assists in identifying areas for improvement and website issues that could be hindering conversions.
3. Returning user conversions
The returning visitor metric keeps tabs on users who have visited your website in the past and whether they’re making conversions when they return. This metric offers insights into your ability to build and retain your audience, allowing you to gauge if you’re meeting their needs upon their return.
Start by utilising web analytics tools to monitor returning user metrics and determine if your website is drawing repeat visitors. Next, delve into POW New Media Session Recordings to observe firsthand what users experience on your website and what prompts them to return. This information will guide your optimisation efforts.
4. Form conversions
Form conversion metrics keep track of how many users complete and submit forms on your website, such as newsletter signups, demo requests, or notification contact forms. Keeping an eye on form conversions is crucial because they often reflect customer interest and can indicate future major conversions.
To get a general idea of how well your forms are performing, monitor form conversion rates. However, for a more detailed analysis, combine standard web analytics with tools like Heatmaps. These tools reveal which form elements users engage with and which they overlook. This insight helps you optimise form design, copy, and placement to improve conversion rates.
5. CTA conversions
CTA conversion metrics measure the percentage of users who clicked on your Call-to-Action (CTA). By tracking CTA conversions, teams can assess the effectiveness of their calls to action and determine if they are motivating users to take the desired action and convert.
6. Bounce rate
Your bounce rate shows the percentage of users who visit your website and then leave without taking any action, like clicking on another page or reading a blog post. It tells you if your site captures users’ interest right away or if you need to make changes to better meet their expectations.
Begin by checking your bounce rate using web analytics software. Then, dive deeper with tools like POW New Media Session Recordings to observe how users interact with your site. This helps you identify where users encounter issues or what makes them to leave quickly.
7. User path
User path analysis is like a map showing what people do on your website. By keeping an eye on user paths, you can see if your website is easy for people to use, and if they can find what they want.
With Google Analytics, you can track how users move around your website. This helps you understand where they might get stuck, so you can fix those spots without changing everything. You can also use POW New Media Surveys to ask users about their experience on your site, which gives you even more information.
8. NPS® score
To find your Net Promoter Score®, ask your users how likely they are to recommend your product or service, rating from 0 to 10. This score helps you see if customers are happy with what you offer and highlights areas where you can improve to make sure more people buy from you in the future.
9. Click and scroll depth metrics
On-page clicks and scroll depth metrics show you how many times people click on your pages and how far they scroll. These numbers give you a good idea of how interested users are in your website and your product.
If your team notices a drop in either metric, it means users might not find your page interesting enough, or they could be getting frustrated with how your product works. This tells you it’s time to make some changes to your pages to stop losing customers.
By knowing where users click, how much they scroll, and if they’re getting frustrated, you can figure out how to make your pages better and get more people to buy your product.
10. Click-through rate
Your click-through rate shows the percentage of users who click on a particular link, like from an email, image, or ad, that takes them to your website. It helps you know if your marketing efforts are working and if they’re bringing people to your site.
If people aren’t clicking on your links to visit your website, they’re probably not going to buy anything. Use web analytics tools to keep an eye on your click-through rate and see how your campaigns are doing. Then, try different ways to talk to your users and use the channels they like best to get them more interested.
Track user-centric CRO metrics to improve UX
Tracking CRO metrics helps you see how good you are at turning users into customers and figure out which pages, paths, & campaigns they like the most. This helps you find problems & chances to make their experience better & get more people to buy from you.
But it’s not just about numbers—you also need to know how users feel about your product. Don’t forget to keep checking your CRO metrics over time to make sure your changes are helping and that your website and product are what users want.